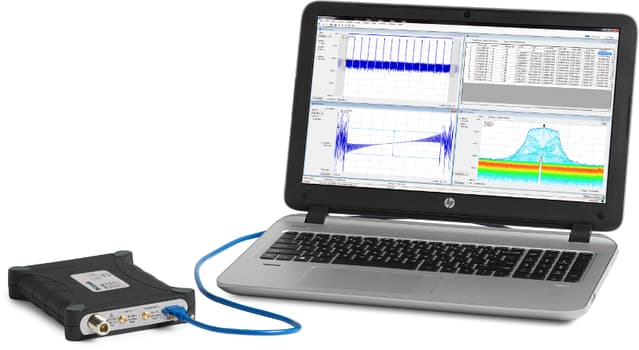
Tektronix RSA500 Series Real Time Spectrum Analyzers
Brand :
Tektronix
Categories :
Spectrum Analyzers
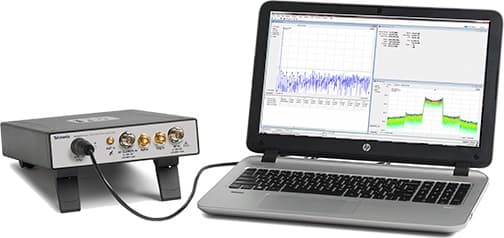
Find signals of interest and take the necessary actions to resolve issues with industries best ruggedized, portable USB Real-time Spectrum Analyzer, packed with features for your most common tasks out in the field.
Specifications
Features and benefits
9 kHz to 3.0/7.5/13.6/18.0 GHz frequency range covers a broad range of analysis needs
40 MHz acquisition bandwidth enables real time analysis for transient capture and vector analysis
High speed full-span sweeps (70 GHz/sec) for fast setup and discovery
Standard GPS/GLONASS/Beidou receiver for mapping
Optional tracking generator for gain/loss, antenna and cable measurements
DataVu-PC software enables multi-unit recording in variable bandwidths
Mil-Std 28800 Class 2 environmental, shock and vibration specifications for use in harsh conditions
Internal battery for extended field operations
SignalVu-PC software offers real time signal processing with DPX® Spectrum/Spectrogram to minimize time spent on transient and interference hunting
EMC/EMI pre-compliance and troubleshooting - CISPR detectors, predefined standards, limit lines, easy accessory setup, ambient capture, failure analysis, and report generation
15 μsec minimum signal duration with 100% probability of intercept ensure you see problems first time, every time
Application programming interface included for development of custom programs
Applications
General purpose spectrum analysis
Radio network installation and maintenance
Spectrum monitoring
Spectrum management
Interference hunting
EMI/EMC compliance testing and troubleshooting
Spectrum operations
Radiation hazard (RADHAZ) testing
Emissions control (EMCON) monitoring
Signal intelligence (SIGINT) monitoring
The RSA500 Series saves you time and helps you succeed
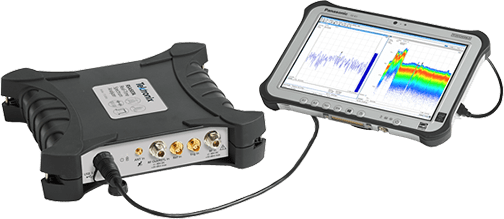
The RSA500 series was built to bring real-time spectrum analysis to solving the problems of spectrum managers, interference hunters and network maintenance personnel who need to track down hard to find interferers, maintain RF networks and keep records of their efforts. The heart of the system is the USB-based RF spectrum analyzer that captures 40 MHz real-time bandwidths with great fidelity in harsh environments. With 70 dB spurious free dynamic range and frequency coverage to 18.0 GHz, all signals of interest can be examined with high confidence in your measurement results. The USB form factor moves the weight of the instrument off of your hands, and replaces it with a lightweight Windows tablet or laptop. Holding a light PC instead of a heavy spectrum analyzer means you can move faster, for longer, and get your work done faster.
The optional tracking generator enables gain/loss measurements for quick tests of filters, duplexers and other network elements, and you can add cable and antenna measurements of VSWR, return loss, distance to fault and cable loss as needed.
SignalVu-PC software offers rich analysis capability in the field
The RSA500 series operates with SignalVu-PC, a powerful program used as the basis of Tek’s traditional spectrum analyzers. SignalVu-PC offers a deep analysis capability previously unavailable in high performance battery-operated solutions. Real-time processing of the DPX® spectrum/spectrogram is enabled in your PC, further reducing the cost of hardware. Customers who need programmatic access to the instrument can choose either the SignalVu-PC programmatic interface or use the included application programming interface (API) that provides a rich set of commands and measurements directly. Basic functionality of the free SignalVu-PC program is far from basic. Base version measurements are shown below.
The RSA500A combined with SignalVu-PC offers advanced field measurements
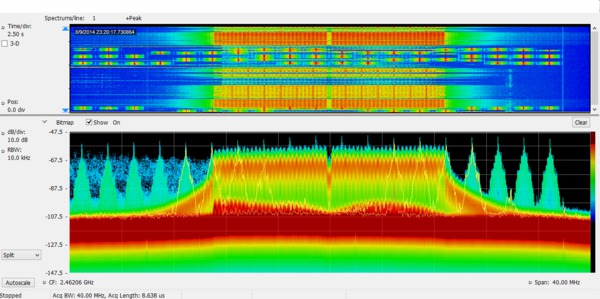
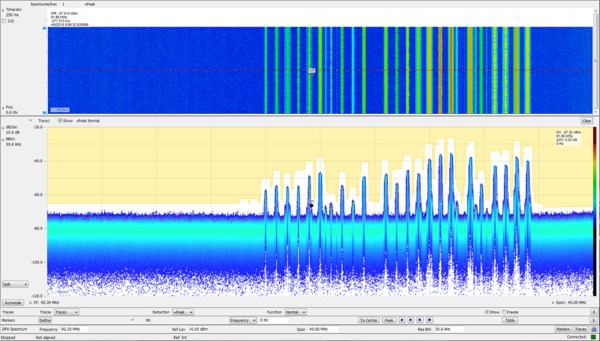
With 40 MHz of real-time bandwidth, the unique DPX® spectrum/spectrogram shows you every instance of an interfering or unknown signal, even down to 15 μs in duration. The following image shows a WLAN transmission (green and orange), and the narrow signals that repeat across the screen are a Bluetooth access probe. The spectrogram (upper part of the screen) clearly separates these signals in time to show any signal collisions.
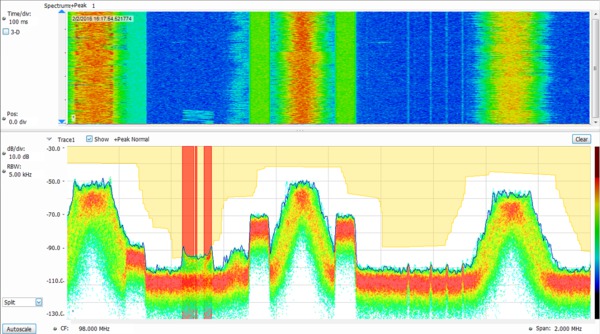
Finding unexpected signals is easy with unattended mask monitoring. A mask can be created on the DPX® spectrum display, and actions taken upon every violation, including stop, save a picture, save acquisition, or send an audible alert. In the illustration below, a mask violation has occurred in red on the mask, and a picture of the screen was saved as a result. Mask testing can be used for unattended monitoring and when playing back recorded signals, enabling testing for different violations on the same signals.
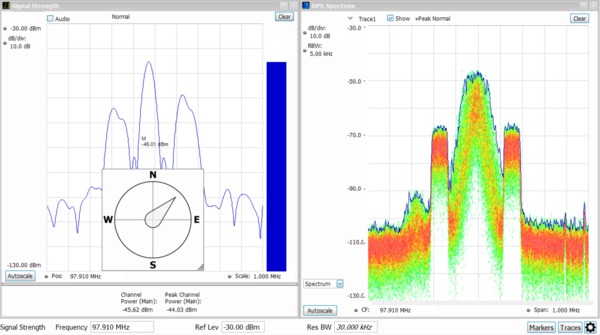
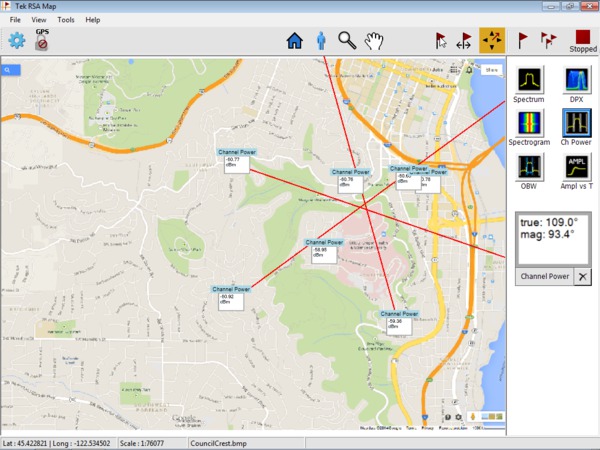
Direction finding and signal strength measurements are quick and easy with the standard SignalVu-PC software. In the illustration below, using the recommended 3rd party Alaris smart antenna, a compass continuously monitors antenna direction while the signal strength monitor performs measurements and provide audio indication of signal strength. When combined with the MAP option for SignalVu-PC, signal strength and azimuth are automatically placed on the map of your choice.
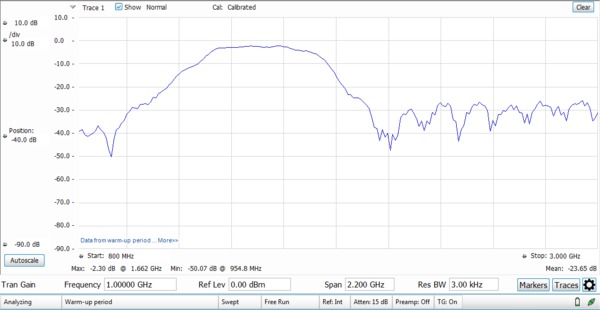
The tracking generator (Option 04 on the RSA500 ) is controlled via SignalVu-PC. A bandpass filter response from 800 MHz to 3 GHz is shown below. Option SV60 adds return loss, cable loss, and distance to fault.
SignalVu-PC application-specific licenses
SignalVu-PC offers a wealth of application-oriented options available either installed on the instrument, or as a floating license that can be moved between instruments or attached to your PC. Applications include:
General-purpose modulation analysis (27 modulation types including 16/32/64/256 QAM, QPSK, O-QPSK, GMSK, FSK, APSK)
EMC/EMI analysis with CISPR peak, quasi-peak, and average detectors
Bluetooth® analysis of Basic Rate, Low Energy, and Bluetooth 5. Some support of Enhanced Data Rate
P25 analysis of phase 1 and phase 2 signals
WLAN analysis of 802.11a/b/g/j/p, 802.11n, 802.11ac
LTE™ FDD and TDD Base Station (eNB) Cell ID and RF measurements
5G New Radio (NR) uplink/downlink RF power, Power dynamics, Signal quality, and Emissions measurements
Mapping
Pulse analysis
AM/FM/PM/Direct Audio Measurement including SINAD, THD
Playback of recorded files, including complete analysis in all domains
Signal classification and survey
See the separate SignalVu-PC data sheet for complete details and ordering information. Selected applications are illustrated below.
EMC/EMI
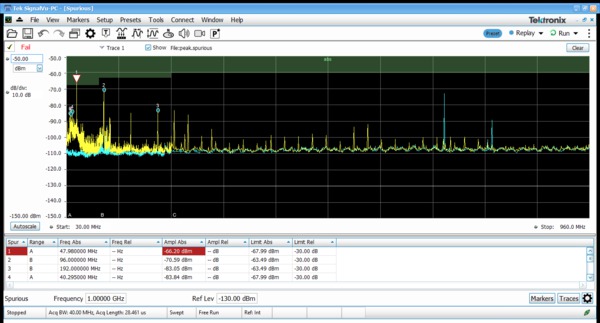
EMI pre-compliance and diagnostic measurements are easy with the instrument and SignalVu-PC. Transducer, antenna, preamplifier, and cable gain/loss can be entered and stored in correction files, and the standard spurious measurement feature of SignalVu-PC can be used to establish limit lines for your test. The following illustration shows a test from 30MHz to 960 MHz against the FCC Part 15 Class A limit shown shaded. The blue trace is the capture of Ambient. Violations are recorded in the results table below the graph. CISPR quasi peak and average detectors can be added with option SVQP.
The EMC pre-compliance solution can be added with option EMCVU. It supports many predefined limit lines. It also adds a wizard for easy setup of recommended antennas, LISN, and other EMC accessories with a one-button push. When using the new EMC-EMI display, you can accelerate the test by applying the time consuming quasi peak only on failures. This display also provides a push-button ambient measurement. The Inspect tool lets you measure frequencies of interest locally, removing the need for scanning.
Bluetooth
Two new options have been added to help with Bluetooth SIG standardbase transmitter RF measurements in the time, frequency and modulation domains. Option SV27 supports Basic Rate and Low Energy Transmitter measurements defined by RF.TS.4.2.0 and RF-PHY.TS.4.2.0 Test Specification. It also demodulates and provides symbol information for Enhanced Data Rate packets. Option SV31 supports Bluetooth 5 standards (LE 1M, LE 2M, LE Coded) and measurements defined in the Core Specification. Both options also decode the physical layer data that is transmitted and color-encode the fields of packet in the Symbol Table for clear identification.
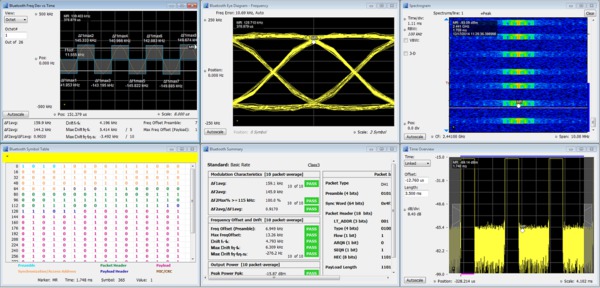
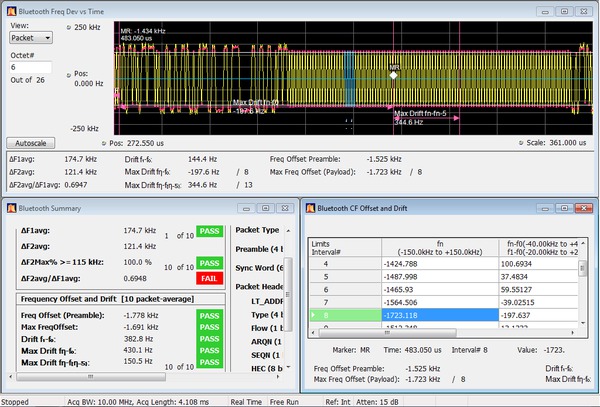
Pass/Fail results are provided with customizable limits. Measurement below shows deviation vs. time, frequency offset and drift and a measurement summary with Pass/Fail results.
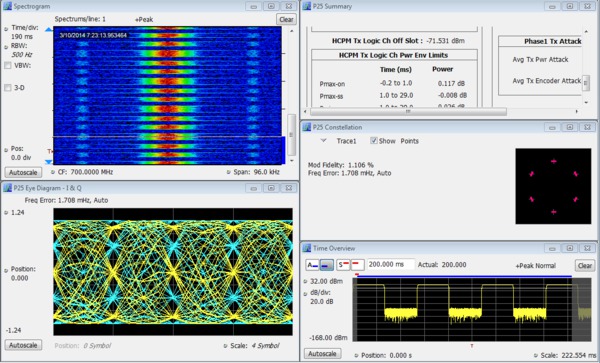
APCO 25
SignalVu-PC application SV26 enables quick, standards-based transmitter health checks on APCO P25 signals. The following image shows a Phase II HCPM signal being monitored for anomalies with the spectrogram while performing transmitter power, modulation and frequency measurements to the TIA-102 standards specification.
LTE
Application SV28 enables the following LTE base station transmitter measurements:
Cell ID
Channel power
Occupied bandwidth
Adjacent channel leakage ratio (ACLR)
Spectrum emission mask (SEM)
Transmitter off power for TDD
Reference Signal (RS) Power
The measurements follow the definition in 3GPP TS Version 12.5 and support all base station categories, including picocells and femtocells. Pass/Fail information is reported and all channel bandwidths are supported.
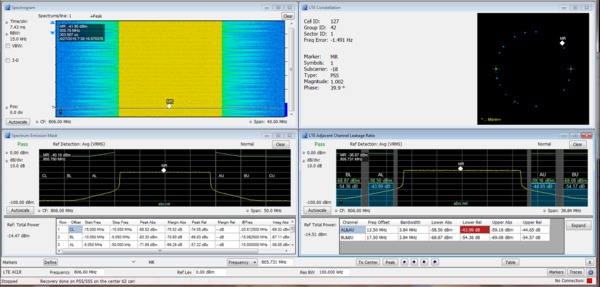
The Cell ID preset displays the Primary Synchronization Signal (PSS) and the Secondary Synchronization Signal (SSS) in a Constellation diagram. It also provides Frequency Error.
The illustration below shows spectral monitoring with the spectrogram display combined with a Cell ID/Constellation, Spectrum Emission Mask and ACLR measurements.
5G NR modulation analysis and measurements option
5G NR is among the growing set of signal standards, applications, and modulation types supported by Vector Signal Analysis (VSA) software. The VSA 5G NR analysis option provides comprehensive analysis capabilities in the frequency, time, and modulation domains for signals based on the 3GPP’s 5G NR specification.
By configuring result traces of spectrum, acquisition time, and NR specific modulation quality (e.g, EVM, frequency error, I/Q error) traces and tables, engineers can identify overall signal characteristics and troubleshoot intermittent error peaks or repeated synchronization failures.
Error Vector Magnitude (EVM) is a figure of merit used to describe signal quality. It does this by measuring the difference on the I/Q plane between the ideal constellation point of the given symbol versus the actual measured point. It can be measured in dB or % of the ideal sub-symbol, normalized to the average QAM power received, and display constellation of symbols vs ideal symbol. The EVM vs Symbol or EVM vs Time gives the EVM of OFDM symbols present in the number of symbols considered or the time within a slot.
For automated testing, SCPI remote interfaces are available to accelerate design, which enables the quick transition to the design verification and manufacturing phases.
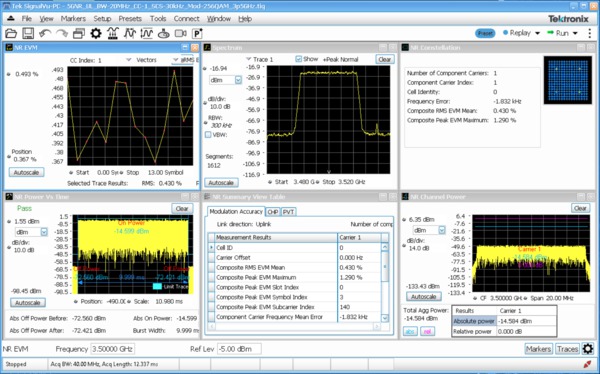
Constellation, Summary View, CHP, and SEM displays supported in option 5G NR
5G NR transmitter measurements core supported features
5G NR option (5GNRNL-SVPC) supports 5G NR modulation analysis measurements according to Release 15 and Release 16 of 3GPP’s TS38 specification, including:
Analysis of uplink and downlink frame structures
5G NR measurements and displays including
Modulation Accuracy (ModAcc)
Channel Power (CHP)
Adjacent Channel Power (ACP)
Spectrum Emission Mask (SEM)
Occupied Bandwidth (OBW)
Power Vs Time (PVT)1
Error Vector Magnitude (EVM)
Summary table with all scalar results for ModAcc, SEM, CHP, ACP, OBW, PVT, and EVM measurements
In-depth analysis and troubleshooting with coupled measurements across domains, use multiple markers to correlate results to find root-cause.
Saves reports in CSV format with configuration parameters and measurement results
Configurable parameters of PDSCH or PUSCH for each component carrier
For downlink, supported test models for FDD and TDD per 3GPP specifications
Mapping
The SignalVu-PC MAP application enables interference hunting and location analysis. Locate interference with an azimuth function that lets you draw a line or an arrow on a mapped measurement to indicate direction, or use the recommended Alaris smart antenna with automated azimuth placement.
Signal survey/classification
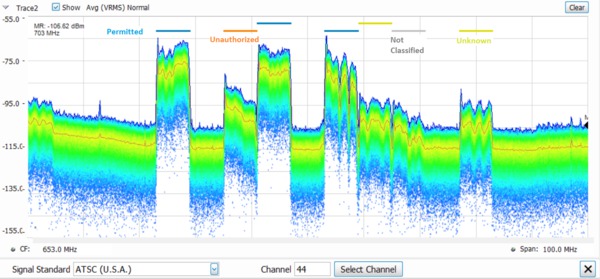
Application SV54 enables expert systems guidance to aid the user in classifying signals. You can quickly create a spectral region of interest, enabling users to identify and sort signals efficiently. The spectral profile mask, when overlaid on top of a trace, provides signal shape guidance while frequency, bandwidth, and channel number are displayed allowing for fast classification. WLAN, GSM, W-CDMA, CDMA, Bluetooth standard and enhanced data rate, LTE FDD and TDD, ATSC and other signals can be quickly and simply identified. Databases can be imported from your H500/RSA2500 signal database library for easy transition to the new software base.
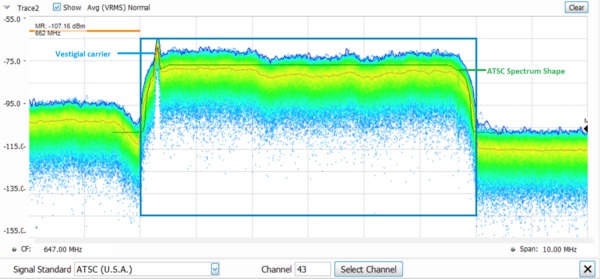
A typical signal survey is show below. The survey is of a portion of the TV broadcast band, and 7 regions have been declared as either Permitted, Unknown, or Unauthorized, as indicated by the color bars for each region. In the detail illustration, a single region has been selected, and since we’ve declared this to be an ATSC video signal, the spectrum mask for the ATSC signal is shown overlaid in the region. The signal is a close match to the spectrum mask, including the vestigial carrier at the lower side of the signal, characteristic of ATSC broadcasts.
Return loss/VSWR, distance to fault, cable loss
Perform maintenance and troubleshooting tasks with ease. When equipped with the option 04 tracking generator, the RSA500A series with application license SV60xx-SVPC makes one-port measurements on cables, devices and antennas.
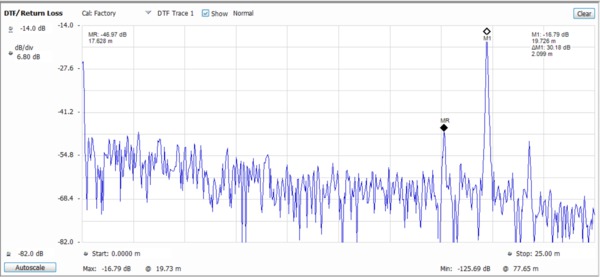
Return loss vs distance for a cable with an inserted barrel and an extension cable. The point at M2 (17.638 m, MR) is the barrel connector and the point marked by M1 at 19.725 m is the end of the cable.
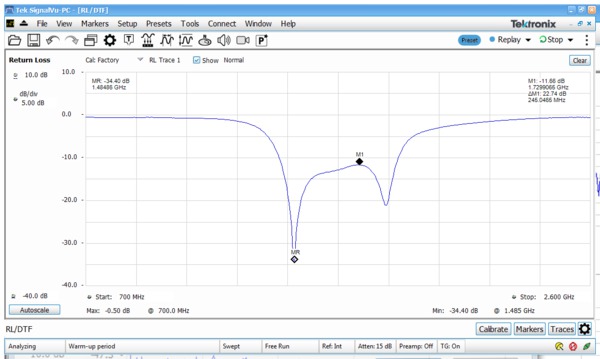
Return loss of a bandpass filter measured from 700 MHz to 2.6 GHz. Markers have been placed a 1.48 GHz (-34.4 dB return loss) and at 1.73 GHz (-11.68 dB return loss), indicating the best and worse match in the passband of the filter.
Playback
Application SV56, Playback of recorded signals, can reduce hours of watching and waiting for a spectral violation to minutes at your desk reviewing recorded data.
Recording length is limited only by storage media size, and recording is a basic feature included in SignalVu-PC. SignalVu-PC application SV56 (Playback) allows for complete analysis by all SignalVu-PC measurements, including DPX Spectrogram. Minimum signal duration specifications are maintained during playback. AM/FM audio demodulation can be performed. Variable span, resolution bandwidth, analysis length, and bandwidth are all available. Frequency mask testing can be performed on recorded signals, with actions on mask violation including beep, stop, save trace, save picture, and save data. Portions of the playback can be selected and looped for repeat examination of signals of interest. Playback can be skip-free, or time gaps can be inserted to reduce review time.
Clock time of the recording is displayed in the spectrogram markers for correlation to real world events. In the illustration below, the FM band is being replayed, with a mask applied to detect spectral violations, simultaneous with listening to the FM signal at the center frequency of 92.3 MHz.
DataVu-PC for multi-instrument recording and analysis of large recordings
DataVu-PC software can control two spectrum analyzers simultaneously with independent settings. This allows you to monitor a wide span, while recording at up to 40 MHz bandwidth at any frequency in the range of the instrument. Once recorded, DataVu-PC can find and mark signals of interest based on amplitude and frequency-mask characteristics, eliminating the need for manual inspection of long recordings. Pulse measurements are available on up to 2,000,000 pulses.
Instrument controller for USB spectrum analyzers
For field operations, a complete solution requires a Windows Tablet or laptop for instrument operation, record keeping and communication. Tektronix recommends the Panasonic FZ-G1 tablet computer for controlling the RSA500 series and as a standalone unit.
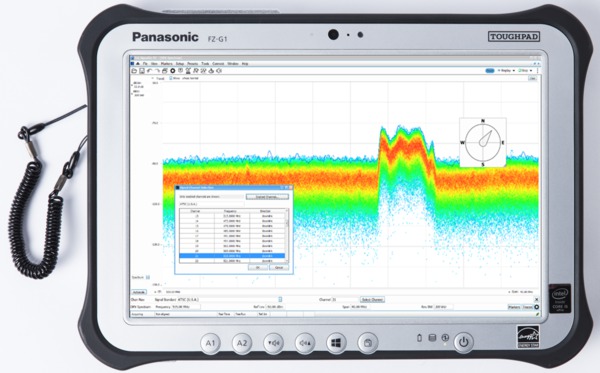
The Panasonic FZ-G1 tablet computer is sold separately and is available for purchase from Panasonic at https://na.panasonic.com/us/computers-tablets-handhelds/tablets/tablets/toughbook-g1 and a variety of third party vendors. Tektronix recommends the FZ-G1 over other tablets because of its performance, portability, and ruggedized form-factor and it has been tested to work with all USB RSA products.
Key specifications, instrument controller
Windows 10 Pro 64-bit operating system
Intel(R) CoreTM i5-6300U vProTM 2.4-3.0 GHz Processor
8GB RAM
256 GB Solid State Drive
10.1" (25.6 cm) Daylight-readable screen
10-point Multi Touch+ Digitizer screen plus included pen interface
USB 3.0 + HDMI Ports, 2nd USB Port
Wi-Fi, Bluetooth® and 4G LTE Multi Carrier Mobile Broadband with Satellite GPS
MIL-STD-810G certified (4' drop, shock, vibration, rain, dust, sand, altitude, freeze/thaw, high/low temperature, temperature shock, humidity, explosive atmosphere)
IP65 certified sealed all-weather design
Integrated microphone
Integrated speaker
On-screen and button volume and mute controls
Integrated battery backup for hot-swap of battery packs
3-year Warranty with Business Class Support (provided by Panasonic in your region)
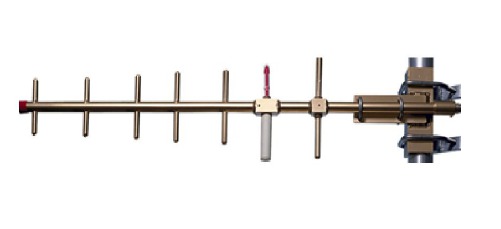
Smart antenna for interference hunting
Tektronix recommends the Alaris smart antenna (DF-A0047) with built-in USB compass for direction finding and interference hunting applications. Full details on the antenna are available from Alaris at https://www.alarisusallc.com/product/df-a0047-handheld-direction-finding-antenna/. A summary of features and specifications is shown below.
Frequency Range: 20 MHz – 8.5 GHz
9 kHz-20 MHz extension available(0.3m loop antenna), contact Alaris.
Trigger control for one-hand operation with functions for:
Preamp on/off
Band switch
Standard armrest extension for ease in long interference hunting sessions
Transit case available
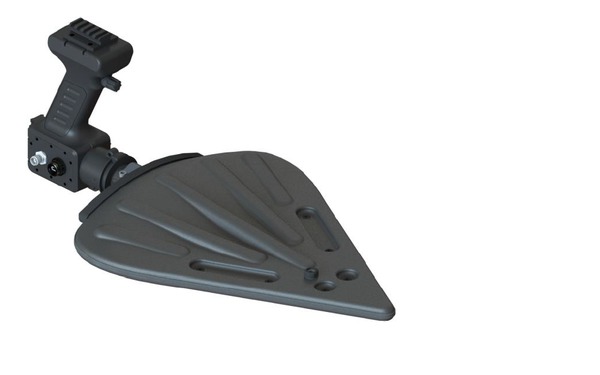
Alaris direction-finding smart antenna.
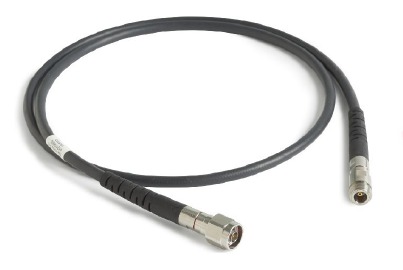
Phase-stabilized cables from Tektronix for cable and antenna measurements
Antennas for interference hunting
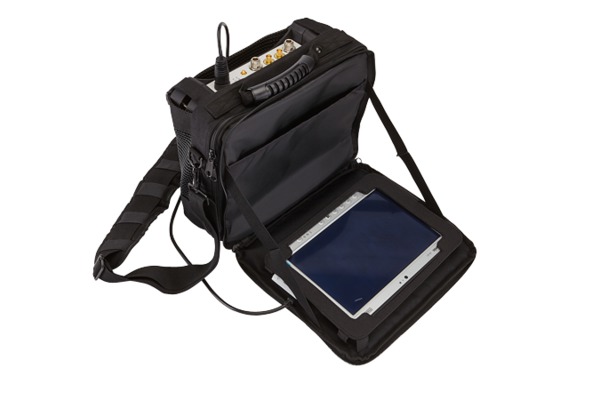
The soft case PN 016-2109-01 is standard with every RSA500A and has room for the unit, a tablet PC and accessories
| Model | Frequency Range | Real-Time Bandwidth | Minimum Event Duration for 100% POI | Weight | SFDR (typical) |
|---|---|---|---|---|---|
| RSA503A | 9 kHz-3.0 GHz | 40 MHz | 15 μs | 2.99 kg (6.6 lb) with battery | 70 dBc |
| RSA507A | 9 kHz-7.5 GHz | 40 MHz | 15 μs | 2.99 kg (6.6 lb) with battery | 70 dBc |
| RSA513A | 9 kHz-13.6 GHz | 40 MHz | 15 μs | 3.85 kg (8.5 pounds) with battery | 70 dBc |
| RSA518A | 9 kHz-18.0 GHz | 40 MHz | 15 μs | 3.85 kg (8.5 pounds) with battery | 70 dBc |